
The average Wandsworth home hit £680,105 in June, up 2.3% after nine straight monthly falls. Over the year it is still down 5.2%, London's eighth steepest fall.
Wandsworth house prices went up in June for the first time since last summer. The average home in the borough reached £680,105, a rise of 2.3 per cent on May, according to the UK House Price Index published on 19 August.
That ends a run of nine straight monthly falls, stretching back to September 2025. It was one of the six strongest monthly rises among London’s 33 boroughs.
One month does not end a slump. Over the full year the borough is still down 5.2 per cent, or £37,057 on the £717,162 average of June 2025. But the annual fall is easing. It was 5.4 per cent in April and 5.3 per cent in May.
Wandsworth against the rest of London
Nineteen of London’s 33 boroughs recorded a fall over the year. Wandsworth’s was the eighth steepest.
The falls are concentrated in the expensive centre and inner west. Westminster is down 25.4 per cent and the City of London 20.4 per cent, though both are small markets where a handful of sales moves the average. Kensington and Chelsea fell 14.7 per cent and Hammersmith and Fulham, directly across the river, 13.3 per cent.
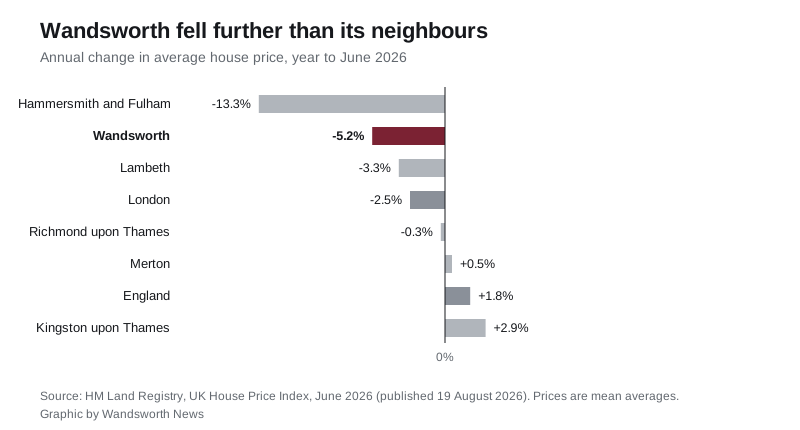
Wandsworth’s immediate neighbours have had a much easier year:
- Hammersmith and Fulham: £725,562, down 13.3 per cent
- Wandsworth: £680,105, down 5.2 per cent
- Lambeth: £548,034, down 3.3 per cent
- Richmond upon Thames: £818,949, down 0.3 per cent
- Merton: £612,681, up 0.5 per cent
- Kingston upon Thames: £594,498, up 2.9 per cent
London as a whole is down 2.5 per cent, at £553,870. England is up 1.8 per cent, at £293,262. Wandsworth is falling in a country where prices are rising.
Flats are doing the damage
Wandsworth is a borough of flats, and flats have fallen hardest. The June figures by property type:
| Property type | Average price | Annual change |
|---|---|---|
| Detached | £2,404,780 | down 4.9% |
| Semi-detached | £1,312,025 | down 4.4% |
| Terraced | £956,162 | down 3.9% |
| Flat | £524,218 | down 5.7% |
The first-time buyer average is £574,578, down 5.2 per cent on a year ago.
Set against the borough’s own record, June’s £680,105 is £87,799 below the October 2022 peak of £767,904. That is a fall of 11.4 per cent from the top, over three and a half years.
Two things to know about these numbers
This is a mean, not a median. The UK House Price Index reports an average that a handful of very large sales can pull upwards, and Wandsworth has plenty of those. Our house prices page uses HM Land Registry’s record of every completed sale, where the borough’s median is a good deal lower than the index average.
The figures get revised. The index is rebuilt each month as more sales are registered. May 2026 was first published as £659,547 and a 6.1 per cent annual fall. In this month’s file the same month reads £664,803 and 5.3 per cent. Treat the newest month as the most provisional.
Sales volumes are not yet published for May or June, because registration lags completion. April 2026 recorded 205 sales. Comparisons with early 2025 are distorted by the stamp duty threshold change of 1 April 2025, which pulled completions forward: Wandsworth logged 924 sales in March 2025 against 248 in March 2026.
What it means for you
If you are selling, the market has stopped sliding but has not recovered. The June average is still £37,057 below where it stood a year ago, and £50 below where it sat in February. Pricing to last summer’s comparables will not work.
If you are buying, the average Wandsworth flat is £524,218 against £555,962 in June 2025, a drop of £31,744. The borough has fallen further than Lambeth, Merton or Richmond, and that gap is the negotiating room. It also means anyone who bought a flat here in the last two years may be sitting on a paper loss.
If you own and are not moving, the number that matters is the October 2022 peak, not last month. Wandsworth is 11.4 per cent below it while England overall is rising, which is worth knowing before you assume a remortgage valuation will come in where you expect.
The July figures are due next month. You can check any street’s actual sold prices on HM Land Registry’s price paid search, and see what is being built near you on our Wandsworth planning page.
Sources
- HM Land Registry, UK House Price Index for June 2026, published 19 August 2026
- HM Land Registry, UK HPI full data file, June 2026 (borough, London, England and property-type figures)
- HM Land Registry, Price Paid Data search
Have your say