
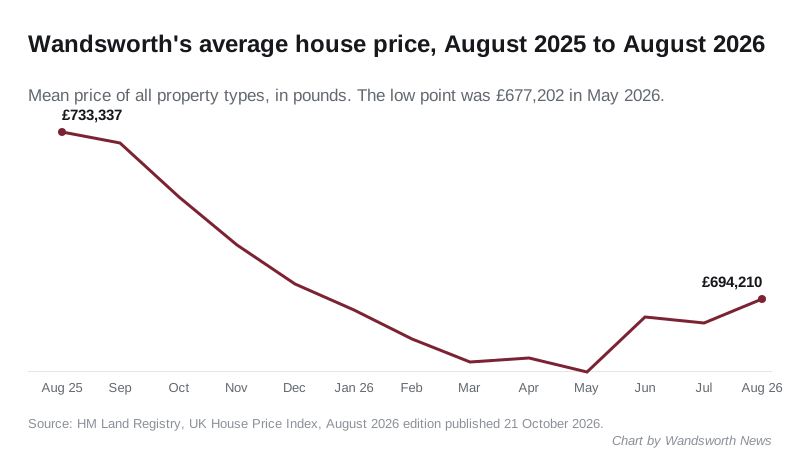
The average Wandsworth home sold for £694,210 in August, down 5.3% in a year, the eighth steepest fall in England. Rents rose 4.1% to £2,640 a month.
The average home in Wandsworth sold for £694,210 in August 2026. That is £39,127 less than a year earlier, a fall of 5.3%. The figures come from HM Land Registry’s house price index, published on 21 October.
Rents went the other way. The Office for National Statistics put the average private rent in the borough at £2,640 a month in September, up 4.1% on a year.
One caution first. The house price index is a mean average, not a median, so a small number of very expensive sales pull it up. It is built from completed sales, so August’s figure mostly reflects deals agreed in the spring.
House prices: a small rise, a bigger annual fall
Prices rose 0.8% between July and August, from £688,595 to £694,210. The annual fall still widened slightly, from 5.2% to 5.3%, because August 2025 was a strong month. The borough average then stood at £733,337.
July’s figure has also been revised. It was first published at £686,076, which we reported as a second monthly rise. Late sales have since been registered, and July now stands at £688,595, a 0.2% dip on June rather than a rise. Local monthly figures move about like this, which is why the annual change is the better guide.
Every type of home except detached houses is cheaper than a year ago. Flats have fallen furthest:
| Type | Average, August 2026 | Change on a year |
|---|---|---|
| Detached | £2,517,820 | +0.1% |
| Semi-detached | £1,364,059 | -1.1% |
| Terraced | £986,873 | -3.1% |
| Flat | £532,028 | -6.5% |
First-time buyers paid an average of £585,383, down 5.8%. People moving on from a home they already owned paid £880,152, down 4.6%. Buyers with a mortgage paid £696,558 on average, and cash buyers £684,530.
Eighth steepest fall in England
Of 295 local authority areas in England, only seven saw prices fall faster than Wandsworth’s 5.3%. All seven are in London, and most are in the centre:
- City of London, down 14.6%
- Westminster, down 14.3%
- Kensington and Chelsea, down 13.8%
- Tower Hamlets, down 13.3%
- Camden, down 10.6%
- Islington, down 8.6%
- Lambeth, down 6.5%
London as a whole averaged £554,430, down 2.2% on the year. England rose 0.4% to £293,525.
Wandsworth’s neighbours split down the middle. Lambeth is falling faster, and Hammersmith and Fulham (down 5.1%) almost as fast. To the south and west, prices are flat or rising: Merton is up 0.1%, Richmond upon Thames is unchanged, and Kingston upon Thames is up 4.9%.
Rents: still rising, but more slowly
The average private rent in Wandsworth was £2,640 a month in September 2026, according to ONS. A year earlier it was £2,535, so the typical tenant is paying £105 a month more.
The pace has roughly halved in two years:
- September 2024: up 8.5% on a year
- September 2025: up 6.4%
- September 2026: up 4.1%
Wandsworth is the seventh dearest of the 32 London boroughs ONS publishes rents for. The London average is £2,338, up 3.5%. Among the neighbours, Hammersmith and Fulham is dearer at £2,861, while Lambeth (£2,538), Richmond upon Thames (£2,349), Merton (£2,181) and Kingston upon Thames (£1,821) are all cheaper.
By size of home, the September averages in Wandsworth were:
| Size | Average monthly rent |
|---|---|
| One bedroom | £1,943 |
| Two bedrooms | £2,469 |
| Three bedrooms | £2,818 |
| Four or more bedrooms | £3,828 |
The average flat or maisonette let for £2,341.
What it means for you
If you are buying, the borough average is about £39,000 lower than a year ago, and flats are down 6.5%. First-time buyers are paying £585,383 on average, still well above the London figure for all homes. A mean average hides big differences between streets, so compare recent sales near the home you want.
If you are selling a flat, expect buyers to know prices are falling. Houses are holding their value much better, and detached homes have not fallen at all.
If you rent, rises are running at about half the pace of two years ago. A landlord asking for much more than 4% at renewal is asking for more than the borough average. Rents vary a lot by area, so compare listings for your size of home.
The next figures, house prices for September and rents for October, are due from the Land Registry and ONS in November. Our Wandsworth house prices page has the standing picture for the borough.
Sources
- HM Land Registry, UK House Price Index for August 2026, published 21 October 2026, and the full data file (Wandsworth’s prices by type and buyer, the revised July figure, the ranking of 295 English areas, the London and England averages)
- Office for National Statistics, Price Index of Private Rents, UK: monthly price statistics, 21 October 2026 edition (Wandsworth’s rent by size and type, the series since 2024, the London borough ranking)
- Office for National Statistics, Housing prices in Wandsworth
Have your say